Showing posts with label visualization. Show all posts

Wednesday, August 26, 2020

Jupyter: JUlia PYThon and R

it's "ggplot2", not "ggplot", but it is ggplot()


Did you know that @projectJupyter's Jupyter Notebook (and JupyterLab) name came from combining 3 programming languages: JUlia, PYThon and R.

Readers of my blog do not need an introduction to Python. But what about the other 2?  

Today we will talk about R. Actually, R and Python, on the Raspberry Pi.

R Origin

R traces its origins to the S statistical programming language, developed in the 1970s at Bell Labs by John M. Chambers. He is also the author of books such as Computational Methods for Data Analysis (1977) and Graphical Methods for Data Analysis (1983). R is an open source implementation of that statistical language. It is compatible with S but also has enhancements over the original.


A quick getting started guide is available here: https://support.rstudio.com/hc/en-us/sections/200271437-Getting-Started


Installing Python

As a recap, in case you don't have Python 3 and a few basic modules, the installation goes as follow (open a terminal window first):


pi@raspberrypi: $ sudo apt install python3 python3-dev build-essential

pi@raspberrypi: $ sudo pip3 install jedi pandas numpy


Installing R

Installing R is equally easy:


pi@raspberrypi: $ sudo apt install r-recommended


We also need to install a few development packages:


pi@raspberrypi: $ sudo apt install libffi-dev libcurl4-openssl-dev libxml2-dev


This will allow us to install many packages in R. Now that R is installed, we can start it:


pi@raspberrypi: $ R

Installing packages

Once inside R, we can install packages using install.packages('name') where name is the name of the package. For example, to install ggplot2 (to install tidyverse, simply replace ggplot2 with tidyverse):

> install.packages('ggplot2')


To load it:


> library(ggplot2)

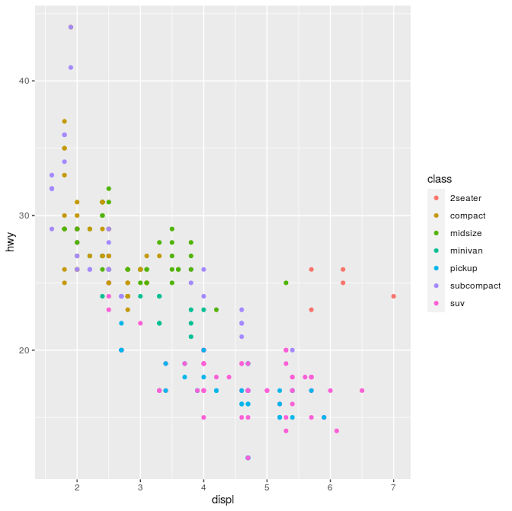
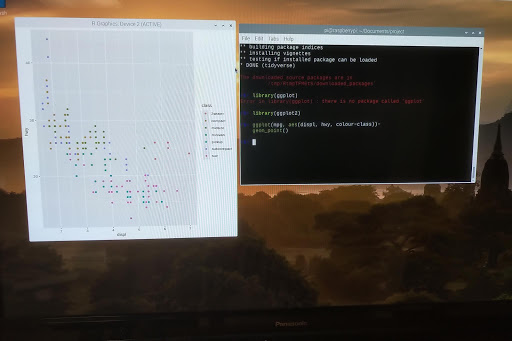
And we can now use it. We will use the mpg dataset and plot displacement vs highway miles per gallon and set the color to:

>ggplot(mpg, aes(displ, hwy, colour=class))+

 geom_point()


Combining R and Python

We can go at this 2 ways, from Python call R, or from R call Python. Here, from R we will call Python.

First, we need to install reticulate (the package that interfaces with Python):

> install.packages('reticulate')

And load it:

> library(reticulate)

We can verify which python binary that reticulate is using:

> py_config()

 Then we can use it to execute some python code. For example, to import the os module and use os.listdir(), from R we do ($ works a bit in a similar fashion to Python's .):

> os <- import("os")
> os$listdir(".")

Or even enter a Python REPL:

> repl_python()
>>> import pandas as pd

>>>


Type exit to leave the Python REPL.

One more trick: Radian

we will now exit R (quit()) and install radian, a command line REPL for R that is fully aware of the reticulate and Python integration:

pi@raspberrypi: $ sudo pip3 install radian


pi@raspberrypi: $ radian

This is just like the R REPL, only better. And you can switch to python very quickly by typing ~:

r$> ~

As soon as the ~ is typed, radian enters the python mode by itself:

r$> reticulate::repl_python()

>>> 

Hitting backspace at the beginning of the line switches back to the R REPL:

r$> 


I'll cover more functionality in a future post.


Francois Dion

Tuesday, February 27, 2018

Stemgraphic v.0.5.x: stem-and-leaf EDA and visualization for numbers, categoricals and text


 Stemgraphic open source


In 2016 at PyDataCarolinas, I open-sourced my stem-and-leaf toolkit for exploratory data analysis and visualization. Later, in October 2016 I had posted the link to the video.


Stemgraphic.alpha


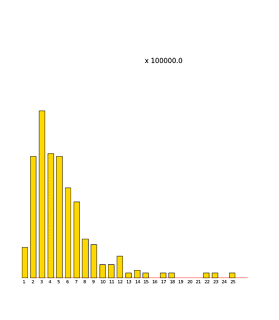
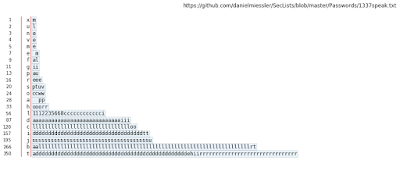
With the 0.5.x releases, I've introduced the categorical and text support. In the next few weeks, I'll be introducing some of the features, particularly those found in the new stemgraphic.alpha module of the stemgraphic package, such as back-to-back plots and stem-and-leaf heatmaps:


But if you want to get started, check out stemgraphic.org, and the github repo (especially the notebooks).

Github Repo

https://github.com/fdion/stemgraphic


Francois Dion
@f_dion

Friday, August 11, 2017

Readings in Visualization

"Ex-Libris" part V: Visualization


Part 5 of my "ex-libris" of a Data Scientist is now available. This one is about visualization.

Starting from a historical perspective, particularly of statistical visualization, and covering a few classic must have books, the article then goes on to cover graphic design, cartography, information architecture and design and concludes with many recent books on information visualization (specific Python and R books to create these were listed in part IV of this series). In all, about 66 books on the subject.

Just follow the link to the LinkedIn post to go directly to it:


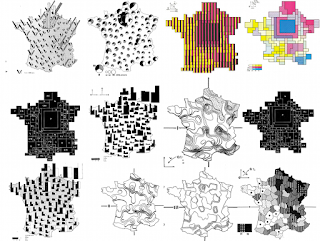
From Jacques Bertin’s Semiology of Graphics

"Le plus court croquis m'en dit plus long qu'un long rapport", Napoleon Ier

See also

Part I was on "data and databases": "ex-libris" of a Data Scientist - Part i
Part II, was on "models": "ex-libris" of a Data Scientist - Part II

Part III, was on "technology": "ex-libris" of a Data Scientist - Part III
Part IV, was on "code": "ex-libris" of a Data Scientist - Part IV
Part VI will be on communication. Bonus after that will be on management / leadership.
Francois Dion
@f_dion

P.S.
Je vais aussi avoir une liste de publications en francais
En el futuro cercano voy a hacer una lista en espanol tambien

Thursday, October 20, 2016

Stemgraphic, a new visualization tool

PyData Carolinas 2016

At PyData Carolinas 2016 I presented the talk Stemgraphic: A Stem-and-Leaf Plot for the Age of Big Data.

Intro

The stem-and-leaf plot is one of the most powerful tools not found in a data scientist or statistician’s toolbox. If we go back in time thirty some years we find the exact opposite. What happened to the stem-and-leaf plot? Finding the answer led me to design and implement an improved graphical version of the stem-and-leaf plot, as a python package. As a companion to the talk, a printed research paper was provided to the audience (a PDF is now available through artchiv.es)

The talk


Thanks to the organizers of PyData Carolinas, videos of all the talks and tutorials have been posted on youtube. In just 30 minutes, this is a great way to learn more about stemgraphic and the history of the stem-and-leaf plot for EDA work. This updated version does include the animated intro sequence, but unfortunately the sound was recorded from the microphone, and not the mixer. You can see the intro sequence in higher audio and video quality on the main page of the website below.

Stemgraphic.org

I've created a web site for stemgraphic, as I'll be posting some tutorials and demo some of the more advanced features, particularly as to how stemgraphic can be used in a data science pipeline, as a data wrangling tool, as an intermediary to big data on HDFS, as a visual validation for building models and as a superior distribution plot, particularly when faced with non uniform distributions or distributions showing a high degree of skewness (long tails).

Github Repo

https://github.com/fdion/stemgraphic


Francois Dion
@f_dion


Friday, September 30, 2016

5 music things

5 in 5

I like to cover 5 things in 5 minutes for lightning talks. Or one thing. At the local
Python user group, sometimes questions or other circumstances turn these 5
in 5 more into a 5 in 10-15...

5 Music Things

Eventually, after a year or two, I'll revisit a subject. I recently noticed that I had
not talked about music related things in almost two and a half years, so I did
5 quick Jupyter notebooks and presented that. Interestingly enough, none of
these 5 things were covered back then. The github repo includes edited versions
of the notebooks, based on the interactions at the meeting during my presentation.
Requirements: All require the following
pip install jupyter
Alphabetically...

1 - Audio

2 - libROSA

Here we will need to pip install matplotlib and numpy, and of course librosa.

3 - music21

pip install music21
You'll need some external programs: Lilypond and Musescore
You also need launch scripts for each of them. On a mac, use the provided
launch scripts in the mac/ folder of this repo. Make sure you chmod a+x them.
Change the path in the notebook to reflect your own user path.

4 - python-sonic

pip install python-sonic
You'll need one external program: Sonic Pi and to start it before running through
the notebook.

5 - pyKnon

pip install pyknon
You'll need one external program: timidity

easily installed:

  • in Linux with apt-get install timidity
  • on a Mac with brew install timidity
This was mostly an excuse to demo that external command line tools like timidity
or sox can be used here.


Have fun!
@f_dion - francois(dot)dion(at)gmail(dot)com

P.S.: Github repo at: https://github.com/fdion/5_music_things but for some strange reason, github will not render the first (0-StartHere) notebook. This blog post is basically that notebook, putting things in context.

Monday, December 28, 2015

The 10 colors of Pi

Picking up patterns

Or the lack thereof. The brain is pretty good at spotting patterns and anomalies. But we have to help it with something that can be easily abstracted. Numbers are not good for that.

Of reds and greens and blues

Colors are good helpers. Shades, hues. Unfortunately, many people are affected by colorblindness. It is said that in some segments of the population, up to 8% of men and 0.4% of women experience congenital color deficiency, with the most common being red-green color blindness.
In [1]:
%matplotlib inline
import matplotlib.pyplot as plt
from matplotlib.patches import Rectangle
import seaborn as sns
sns.set_context("talk")

Seaborn palettes

According to Seaborn's documentation (http://web.stanford.edu/~mwaskom/software/seaborn/tutorial/color_palettes.html), there is a ready made color palette called colorblind. There is not a lot of details on this, so I thought I'd experiment with this and ask for feedback. Unfortunately, only 6 colors are available until it starts recycling itself. That is clearly not good if we want to see patterns in numbers that range from 0 to 9 on each digit.
Another interesting choice is cubehelix. It works in color and grayscale. You can learn more about it here: http://www.mrao.cam.ac.uk/~dag/CUBEHELIX/
First thing first, let's set it as the default palette, and display it.
In [2]:
sns.set_palette(sns.color_palette("cubehelix", 10))
sns.palplot(sns.color_palette())

An infinite source of entertainment

At the very least, an infinite source of digits: pi
So we will be plotting a large grid, with each square representing a digit of pi and filled in the color corresponding to the color in the Seaborn palette. Let's grab a pi digit generator. There is one here that's been around since the days of python 2.5:
https://www.daniweb.com/programming/software-development/code/249177/pi-generator-update
In [3]:
def pi_generate():
    """
    generator to approximate pi
    returns a single digit of pi each time iterated
    """
    q, r, t, k, m, x = 1, 0, 1, 1, 3, 3
    while True:
        if 4 * q + r - t < m * t:
            yield m
            q, r, t, k, m, x = 10*q, 10*(r-m*t), t, k, (10*(3*q+r))//t - 10*m, x
        else:
            q, r, t, k, m, x = q*k, (2*q+r)*x, t*x, k+1, (q*(7*k+2)+r*x)//(t*x), x+2

The 10 colors of Pi

We are now ready to do our actual visualization of pi.
For legal size paper, 55x97 is a good size (plus the ratio is the square root of pi). For poster, I use 154 x 204 = 31416 digits :)
It'll run for a while, even at the reduced size, probably a good time to go and get your favorite drink...
In [4]:
width = 55  # 154
height = 97  # 204 
digit = pi_generate()

fig = plt.figure(figsize=((width + 2) / 3., (height + 2) / 3.))
ax = fig.add_axes((0.05, 0.05, 0.9, 0.9),
                  aspect='equal', frameon=False,
                  xlim=(-0.05, width + 0.05),
                  ylim=(-0.05, height + 0.05))

for axis in (ax.xaxis, ax.yaxis):
    axis.set_major_formatter(plt.NullFormatter())
    axis.set_major_locator(plt.NullLocator())
    
for j in range(height-1,-1,-1):
    for i in range(width):
        pi_digit = next(digit)
        ax.add_patch(Rectangle((i, j),
                               width=1,
                               height=1,
                               ec=sns.color_palette()[pi_digit],
                               fc=sns.color_palette()[pi_digit],
                              )
                    )
        ax.text(i + 0.5, j + 0.5,
                pi_digit, color='k',
                fontsize=10,
                ha='center', va='center')
ax.text(0,-1,"'THE 10 COLORS OF PI' by Francois Dion", fontsize=15)
Out[4]:
<matplotlib.text.Text at 0x10966f1d0>

The original jupyter notebook can be downloaded here:
https://github.com/fdion/infographics_research/blob/master/The%2010%20colors%20of%20Pi.ipynb

Francois Dion
@f_dion