Showing posts with label english. Show all posts

Wednesday, August 26, 2020

Jupyter: JUlia PYThon and R

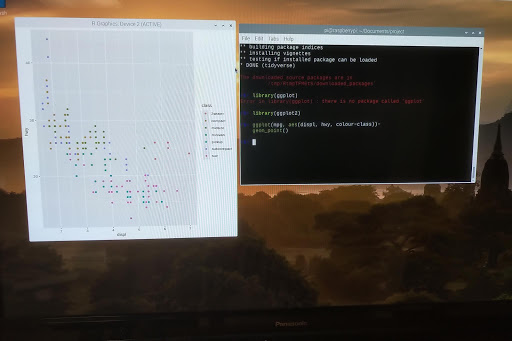
it's "ggplot2", not "ggplot", but it is ggplot()


Did you know that @projectJupyter's Jupyter Notebook (and JupyterLab) name came from combining 3 programming languages: JUlia, PYThon and R.

Readers of my blog do not need an introduction to Python. But what about the other 2?  

Today we will talk about R. Actually, R and Python, on the Raspberry Pi.

R Origin

R traces its origins to the S statistical programming language, developed in the 1970s at Bell Labs by John M. Chambers. He is also the author of books such as Computational Methods for Data Analysis (1977) and Graphical Methods for Data Analysis (1983). R is an open source implementation of that statistical language. It is compatible with S but also has enhancements over the original.


A quick getting started guide is available here: https://support.rstudio.com/hc/en-us/sections/200271437-Getting-Started


Installing Python

As a recap, in case you don't have Python 3 and a few basic modules, the installation goes as follow (open a terminal window first):


pi@raspberrypi: $ sudo apt install python3 python3-dev build-essential

pi@raspberrypi: $ sudo pip3 install jedi pandas numpy


Installing R

Installing R is equally easy:


pi@raspberrypi: $ sudo apt install r-recommended


We also need to install a few development packages:


pi@raspberrypi: $ sudo apt install libffi-dev libcurl4-openssl-dev libxml2-dev


This will allow us to install many packages in R. Now that R is installed, we can start it:


pi@raspberrypi: $ R

Installing packages

Once inside R, we can install packages using install.packages('name') where name is the name of the package. For example, to install ggplot2 (to install tidyverse, simply replace ggplot2 with tidyverse):

> install.packages('ggplot2')


To load it:


> library(ggplot2)

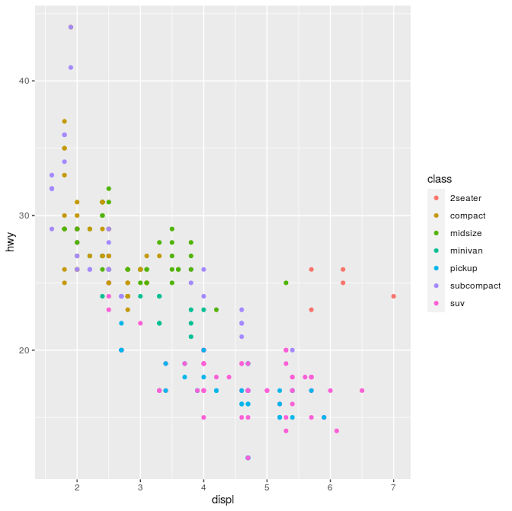
And we can now use it. We will use the mpg dataset and plot displacement vs highway miles per gallon and set the color to:

>ggplot(mpg, aes(displ, hwy, colour=class))+

 geom_point()


Combining R and Python

We can go at this 2 ways, from Python call R, or from R call Python. Here, from R we will call Python.

First, we need to install reticulate (the package that interfaces with Python):

> install.packages('reticulate')

And load it:

> library(reticulate)

We can verify which python binary that reticulate is using:

> py_config()

 Then we can use it to execute some python code. For example, to import the os module and use os.listdir(), from R we do ($ works a bit in a similar fashion to Python's .):

> os <- import("os")
> os$listdir(".")

Or even enter a Python REPL:

> repl_python()
>>> import pandas as pd

>>>


Type exit to leave the Python REPL.

One more trick: Radian

we will now exit R (quit()) and install radian, a command line REPL for R that is fully aware of the reticulate and Python integration:

pi@raspberrypi: $ sudo pip3 install radian


pi@raspberrypi: $ radian

This is just like the R REPL, only better. And you can switch to python very quickly by typing ~:

r$> ~

As soon as the ~ is typed, radian enters the python mode by itself:

r$> reticulate::repl_python()

>>> 

Hitting backspace at the beginning of the line switches back to the R REPL:

r$> 


I'll cover more functionality in a future post.


Francois Dion

Sunday, March 11, 2018

Are you smarter than a fifth grader?

"the editorial principle that nothing should be given both graphically and in tabular form has to become unacceptable" - John W. Tukey

Back to school

In the United States, most fifth grade students are learning about a fairly powerful type of visualization of data. In some states, it starts at an even younger age, in the 4th grade. As classwork and homework, they will produce many of these plots:


They are called stem-and-leaf displays, or stem-and-leaf plots. The left side of the vertical bar is the stem, and the right side, the leaves. The key or scale is important as it indicates the multiplier. The top row in the image above has a stem of 2 and leaves 0,6 and 7, representing 20, 26 and 27. Invented by John W. Tukey in the 1970's (see the statistics section of part II and the classics section of part V of my "ex-libris" series), few people use them once they leave school. Doing stem-and-leaf plots by hand is not the most entertaining thing to do. The original plot was also limited to handling small data sets. But there is a variation on the original display that gets around these limitations.

"Data! Data! Data!"

Powerful? Why did I say that in the first paragraph?

And why should stem-and-leaf plots be of interest to students, teachers, analysts, data scientists, auditors, statisticians, economists, managers and other people teaching, learning or working with data? There are a few reasons, with the two most important being:
  • they represent not only the overall distribution of data, but the individual data points themselves (or a close approximation)
  • They can be more useful than histograms as data size increases, particularly on long tailed distributions


An example with annual salaries

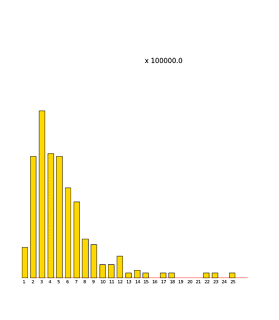
We will look at a data set of the salaries for government employees in Texas (over 690,000 values, from an August 2016 snapshot of the data from the Texas Tribune Salary Explorer). From this we create a histogram, one of the most popular plot for looking at distributions. As can be seen, we can't really tell any detail (left is Python Pandas hist, right is R hist):


It really doesn't matter the language or software package used, we get one very large bar with almost all the observations, and perhaps (as in R or seaborn), a second tiny bar next to it. A box plot (another plot popularized by John Tukey) would have been a bit more useful here adding some "outliers" dots. And, how about a stem-and-leaf plot? We are not going to sort and draw something by hand with close to 700,000 values...

Fortunately, I've built a package (python modules plus a command line tool) that handles stem-and-leaf plots at that scale (and much, much larger). It is available from http://stemgraphic.org and also from github (the code has been available as open source since 2016) and pypi (pip install stemgraphic).
So how does it look for the same data set?


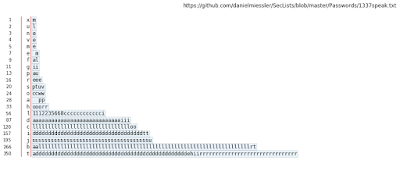
Now we can see a lot of detail. Scale was automatically found to be optimal as 10000, with consecutive stems ranging from 0 to 35 (350000). We can read numbers directly, without having to refer to a color coded legend or other similar approach. At the bottom, we see a value of 0.00 (who works and is considered employed for $0 annual income? apparently, quite a few in this data set), and a maximum of $5,266,667.00 (hint, sports related), we see a median of about $42K and we see multiple classes of employees, ranging from non managerial, to middle management, upper management and beyond ($350,000+). We've limited the display here to 500 observations, and that is what the aggregate count on the leftmost column tells us. Notice also how we have a convenient sub-binning going on, allowing us to see which $1000 ranges are more common. All this from one simple display. And of course we can further trim, zoom, filter or limit what data or slice of data we want to inspect.

Knowing your data (particularly at scale) is a fundamental first step to turning it into insight. Here, we were able to know our data a lot better by simply using the function stem_graphic() instead of hist() (or use the included stem command line tool - compatible with Windows, Mac OS and Linux).

Tune in next episode...

Customers already using my software products for data governance, anomaly detection and data quality are already familiar with it. Many other companies, universities and individuals are using stemgraphic in one way or another. For everybody else, hopefully this has raised your interest, you'll master this visualization in no time, and you'll be able to answer the title question affirmatively...

Stemgraphic has another dozen types of visualizations, including some interactive and beyond numbers, adding support for categorical data and for text (as of version 0.5.x). In the following months I'll talk a bit more about a few of them.


Francois Dion
@f_dion

N.B. This article was originally published on LinkedIn at:

https://www.linkedin.com/pulse/you-smarter-than-fifth-grader-francois-dion/

Tuesday, February 27, 2018

Stemgraphic v.0.5.x: stem-and-leaf EDA and visualization for numbers, categoricals and text


 Stemgraphic open source


In 2016 at PyDataCarolinas, I open-sourced my stem-and-leaf toolkit for exploratory data analysis and visualization. Later, in October 2016 I had posted the link to the video.


Stemgraphic.alpha


With the 0.5.x releases, I've introduced the categorical and text support. In the next few weeks, I'll be introducing some of the features, particularly those found in the new stemgraphic.alpha module of the stemgraphic package, such as back-to-back plots and stem-and-leaf heatmaps:


But if you want to get started, check out stemgraphic.org, and the github repo (especially the notebooks).

Github Repo

https://github.com/fdion/stemgraphic


Francois Dion
@f_dion

Monday, February 26, 2018

Readings in Communication

"Ex-Libris" part VI: Communication

Part 6 of my "ex-libris" of a Data Scientist is now available. This one is about communication.
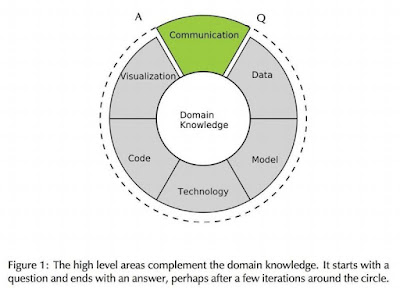
When I started this series, I introduced this diagram.

I also quoted Johh Tukey:
"Far better an approximate answer to the right question, which is often vague, than an exact answer to the wrong question, which can always be made precise" 

This is quite important since a data science project has to start with a question and come up with an answer.

But how do we communicate at the time of formulating the question? How about at the time of providing an answer? By any means necessary.

Do check out the full article with the list of books:

"ex-libris" part vi


See also

Part I was on "data and databases": "ex-libris" of a Data Scientist - Part i
Part II, was on "models": "ex-libris" of a Data Scientist - Part II

Part III, was on "technology": "ex-libris" of a Data Scientist - Part III
Part IV, was on "code": "ex-libris" of a Data Scientist - Part IV
Part V was on "visualization". Bonus after that will be on management / leadership.
Francois Dion
@f_dion

Friday, August 11, 2017

Readings in Visualization

"Ex-Libris" part V: Visualization


Part 5 of my "ex-libris" of a Data Scientist is now available. This one is about visualization.

Starting from a historical perspective, particularly of statistical visualization, and covering a few classic must have books, the article then goes on to cover graphic design, cartography, information architecture and design and concludes with many recent books on information visualization (specific Python and R books to create these were listed in part IV of this series). In all, about 66 books on the subject.

Just follow the link to the LinkedIn post to go directly to it:


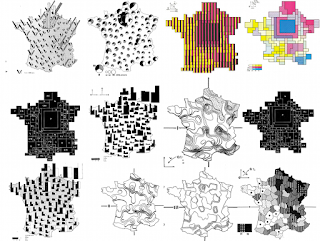
From Jacques Bertin’s Semiology of Graphics

"Le plus court croquis m'en dit plus long qu'un long rapport", Napoleon Ier

See also

Part I was on "data and databases": "ex-libris" of a Data Scientist - Part i
Part II, was on "models": "ex-libris" of a Data Scientist - Part II

Part III, was on "technology": "ex-libris" of a Data Scientist - Part III
Part IV, was on "code": "ex-libris" of a Data Scientist - Part IV
Part VI will be on communication. Bonus after that will be on management / leadership.
Francois Dion
@f_dion

P.S.
Je vais aussi avoir une liste de publications en francais
En el futuro cercano voy a hacer una lista en espanol tambien

Tuesday, June 13, 2017

Readings in Programming

"Ex-Libris" part IV: Code


I've made available part 4 of my "ex-libris" of a Data Scientist. This one is about code. 

No doubt, many have been waiting for the list that is most related to Python.  In a recent poll by KDNuggets, the top tool used for analytics, data science and machine learning by respondents turned out to also be a programming language: Python.

The article goes from algorithms and theory, to approaches, to the top languages for data science, and more. In all, almost 80 books in just that part 4 alone. It can be found on LinkedIn:

"ex-libris" of a Data Scientist - Part IV

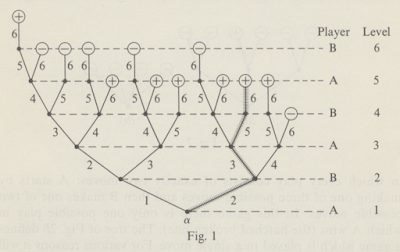
from Algorithms and Automatic Computing Machinesby B. A. Trakhtenbrot


See also


Part I was on "data and databases": "ex-libris" of a Data Scientist - Part i

Part II, was on "models": "ex-libris" of a Data Scientist - Part II


Part III, was on "technology": "ex-libris" of a Data Scientist - Part III

Part V will be on visualization, part VI on communication. Bonus after that will be on management / leadership.

Francois Dion
@f_dion

P.S.
Je vais aussi avoir une liste de publications en francais
En el futuro cercano voy a hacer una lista en espanol tambien

Saturday, June 3, 2017

Readings in Technology

"Ex-Libris" part III


I've made available part 3 of my "ex-libris" of a Data Scientist. This one is on Technology, from some historical perspective (ie. Turing, Shannon, Von Neuman) all the way to the most recent trends (ie. Ansible, Docker, Cloud, Continuous Integration, Performance etc) and can be found on LinkedIn:

"ex-libris" of a Data Scientist - Part III

My CES Industries EdLab model #804, in the History section


See also


Part I was on "data and databases": "ex-libris" of a Data Scientist - Part i

Part II, was on "models": "ex-libris" of a Data Scientist - Part II

Part IV is right around the corner, and will have a significant Python section.


Francois Dion
@f_dion

Friday, June 2, 2017

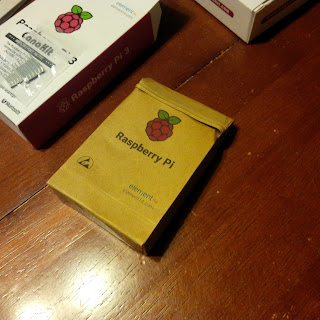
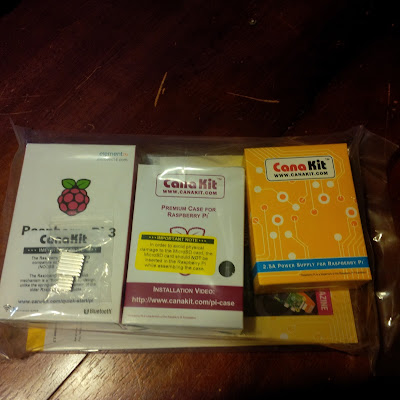
Raspberry Pi 3 Canakit

It's been a long time...


I don't even remember when was the last time I talked about Raspberry Pi hardware on my blog. I do remember the first time, however, some 5 years ago. Meanwhile, the price of Raspberry Pis have both gone down (Zero) and up (Raspberry Pi 3) due to economies of scale, Moore's law and removal / addition of components from the various versions.

Raspberry Pi 3


So, I realize that I've covered everything from the original Raspberry Pi model B with 256MB of ram, all the way to the Raspberry Pi 2 and Zero, but nothing on the Raspberry Pi 3. I typically don't buy kits, but I picked one up to see how that would work for people who had never used a Raspberry Pi before. The reason there is that I suggested to my fellow data scientists (and those interested by data science, and whoever else who reads my posts) to also be technologists, to get better acquainted with technology and hardware. And to get one (or four - I'll follow up on that) Raspberry Pi 3. I wanted to make sure it would be smooth sailing.

The Canakit


I ordered a Canakit with a Raspberry Pi board and two heatsinks, a case, a 2.5A power supply and a guide. It is convenient to get a single ready to go package quickly, particularly with free 2nd day shipping (you know who).

I say ready to go, but not quite. Of course you'll need a monitor, keyboard and mouse if you don't enable ssh (distro dependent ways, some have ssh enabled by default). But you'll also need an SD card.

No SD card?


The kit I ordered basically got you the case, heatsinks and power supply for $15 above the price of the Raspberry Pi 3. But no microSD card. The step above kit includes a microSD card with the OS already pre-installed, but when I looked at it, the price difference was too much for just that and a plain HDMI cable.

Oh, but it's so hard to prepare an SD card! Don't panic. Use Etcher. Later, when you get your command line skills up, you'll be able to do it with dd.

If you get stuck, leave a comment or contact me on twitter

Francois Dion
@f_dion

Monday, May 8, 2017

Readings in Data Science models

Ex-libris


As I've previously mentioned, I recently started a 6 part series on LinkedIn called "ex-libris" of a Data Scientist. 

Part I was on "data and databases": "ex-libris" of a Data Scientist - Part i

I just posted part II, "models": "ex-libris" of a Data Scientist - Part II

It does cover machine learning, but before going there, I cover Metrics, Operations Research, Econometrics and Time Series and Statistics. Even more fundamentally, I start with Math.

Yes, if you slept through linear algebra or calculus (or analysis as it is called in certain parts of the world), check the list out. Book suggestions and links to videos and other resources.


Also, a reminder: Python specific books will show up in part IV.


Francois Dion
@f_dion

Monday, April 24, 2017

Meet Eliza #AI


I will be presenting and directing a discussion on artificial intelligence, from various angles including the arts, Tuesday April 25th at Wake Forest in Winston Salem, NC.

Details here:
http://www.pyptug.org/2017/04/pyptug-monthly-meeting-meet-eliza-april.html

Francois Dion
@f_dion

Thursday, April 13, 2017

Readings in data and databases

Recent readings (can you guess/decipher some of them?)

I've been fairly quiet on this particular blog this year. Beside a lot of data science work, I've done presentations at meetups and conferences, including a recent tutorial on "Getting to know your data at scale" at the IEEE SouthEastCon 2017. Notebooks will be posted on github soon.

But, in the meantime...

Ex-libris

Something else I've been doing is publishing a few articles here and there. Just recently, I started a 6 part series on LinkedIn called "ex-libris" of a Data Scientist. I think many readers of this blog will appreciate this series, and particularly this first installment on "data and databases":

"ex-libris" of a Data Scientist - Part i

It covers a good variety of books on the subject, some pretty much must read for whatever corner of the computer science world you live in. Also of interest will be the Postgres, Hadoop and graph database pointers and a list of over 20 curated must read papers in the field.

Python specific books will show up in part IV.


Francois Dion
@f_dion

Monday, November 7, 2016

Something For Your Mind, Polymath Podcast episode 3

"Improving your communications and Entrepreneurship"

In this episode, , we will cover these two different topics. Specifically, we will talk about kinematic displays, improving your communications, coworking spaces, entrepreneurship, innovation and more. This episode will wrap up with a learn more section, on what is an entrepreneur.
"these are people that can't help but generate ideas all the time..."


A few selected links are on the episode web page, and includes a few items related to colors (some for all platforms, others are Linux only)


Something for your mind is available on

art·chiv.es
/'ärt,kīv/


Francois Dion
@f_dion

Thursday, October 20, 2016

Stemgraphic, a new visualization tool

PyData Carolinas 2016

At PyData Carolinas 2016 I presented the talk Stemgraphic: A Stem-and-Leaf Plot for the Age of Big Data.

Intro

The stem-and-leaf plot is one of the most powerful tools not found in a data scientist or statistician’s toolbox. If we go back in time thirty some years we find the exact opposite. What happened to the stem-and-leaf plot? Finding the answer led me to design and implement an improved graphical version of the stem-and-leaf plot, as a python package. As a companion to the talk, a printed research paper was provided to the audience (a PDF is now available through artchiv.es)

The talk


Thanks to the organizers of PyData Carolinas, videos of all the talks and tutorials have been posted on youtube. In just 30 minutes, this is a great way to learn more about stemgraphic and the history of the stem-and-leaf plot for EDA work. This updated version does include the animated intro sequence, but unfortunately the sound was recorded from the microphone, and not the mixer. You can see the intro sequence in higher audio and video quality on the main page of the website below.

Stemgraphic.org

I've created a web site for stemgraphic, as I'll be posting some tutorials and demo some of the more advanced features, particularly as to how stemgraphic can be used in a data science pipeline, as a data wrangling tool, as an intermediary to big data on HDFS, as a visual validation for building models and as a superior distribution plot, particularly when faced with non uniform distributions or distributions showing a high degree of skewness (long tails).

Github Repo

https://github.com/fdion/stemgraphic


Francois Dion
@f_dion


Tuesday, October 11, 2016

PyData Carolinas 2016 Tutorial: Datascience on the web

PyData Carolinas 2016

Don Jennings and I presented a tutorial at PyData Carolinas 2016: Datascience on the web.

The plan was as follow:

Description

Learn to deploy your research as a web application. You have been using Jupyter and Python to do some interesting research, build models, visualize results. In this tutorial, you’ll learn how to easily go from a notebook to a Flask web application which you can share.

Abstract

Jupyter is a great notebook environment for Python based data science and exploratory data analysis. You can share the notebooks via a github repository, as html or even on the web using something like JupyterHub. How can we turn the work we have done in the notebook into a real web application?
In this tutorial, you will learn to structure your notebook for web deployment, how to create a skeleton Flask application, add a model and add a visualization. While you have some experience with Jupyter and Python, you do not have any previous web application experience.
Bring your laptop and you will be able to do all of these hands-on things:
  1. get to the virtual environment
  2. review the Jupyter notebook
  3. refactor for reuse
  4. create a basic Flask application
  5. bring in the model
  6. add the visualization
  7. profit!
Now that is has been presented, the artifacts are a github repo and a youtube video.

Github Repo


https://github.com/fdion/pydata/

After the fact

The unrefactored notebook is here while the refactored one is here.
Once you run through the whole refactored notebook, you will have train and test sets saved in data/ and a trained model in trained_models/. To make these available in the tutorial directory, you will have to run the publish.sh script. On a unix like environment (mac, linux etc):
chmod a+x publish.sh
./publish.sh

Video

The whole session is now on youtube: Francois Dion & Don Jennings Datascience on the web

Francois Dion
@f_dion

Thursday, October 6, 2016

Improving your communications: Professional Audio-Video Production on Linux

Pro AV on Linux

I'll be presenting on the subject of Professional Audio-Video Production on Linux, next week at TriLug.


From concept to finished product, it has never been easier to obtain professional results when it comes to audio-video production on Linux.

We will cover some of the hardware that should be part of your production suite, from microphones to jog wheels and highlight some of the top tools for animation, audio, broadcasting, effects, modeling, music, transcoding and video. We will also go beyond the usual suspects and introduce some tools that might not be typically used for AV production.
By the end of the presentation, you will have all the tools you need to improve the quality of your communications, for your personal enjoyment, your career, or your business.

When

Thursday, 13 October 2016 - 7:00pm to 9:00pm
Where
The Frontier, 800 Park Offices Drive, Durham, NC
Francois Dion
@f_dion

Wednesday, October 5, 2016

Something For Your Mind, Polymath Podcast episode 2

A is for Anomaly

In this episode, "A is for Anomaly", our first of the alphabetical episodes, we cover financial fraud, the Roman quaestores, outliers, PDFs and EKGs. Bleep... Bleep... Bleep...
"so perhaps this is not the ideal way of keeping track of 15 individuals..."

Something for your mind is available on


art·chiv.es

/'ärt,kīv/


Francois Dion
@f_dion
P.S. There is a bit more detail on this podcast as a whole, on linkedin.

Friday, September 30, 2016

5 music things

5 in 5

I like to cover 5 things in 5 minutes for lightning talks. Or one thing. At the local
Python user group, sometimes questions or other circumstances turn these 5
in 5 more into a 5 in 10-15...

5 Music Things

Eventually, after a year or two, I'll revisit a subject. I recently noticed that I had
not talked about music related things in almost two and a half years, so I did
5 quick Jupyter notebooks and presented that. Interestingly enough, none of
these 5 things were covered back then. The github repo includes edited versions
of the notebooks, based on the interactions at the meeting during my presentation.
Requirements: All require the following
pip install jupyter
Alphabetically...

1 - Audio

2 - libROSA

Here we will need to pip install matplotlib and numpy, and of course librosa.

3 - music21

pip install music21
You'll need some external programs: Lilypond and Musescore
You also need launch scripts for each of them. On a mac, use the provided
launch scripts in the mac/ folder of this repo. Make sure you chmod a+x them.
Change the path in the notebook to reflect your own user path.

4 - python-sonic

pip install python-sonic
You'll need one external program: Sonic Pi and to start it before running through
the notebook.

5 - pyKnon

pip install pyknon
You'll need one external program: timidity

easily installed:

  • in Linux with apt-get install timidity
  • on a Mac with brew install timidity
This was mostly an excuse to demo that external command line tools like timidity
or sox can be used here.


Have fun!
@f_dion - francois(dot)dion(at)gmail(dot)com

P.S.: Github repo at: https://github.com/fdion/5_music_things but for some strange reason, github will not render the first (0-StartHere) notebook. This blog post is basically that notebook, putting things in context.