Open
Description
According to the documentation:
By default, Plotly Express lays out categorical data in the order in which it appears in the underlying data.
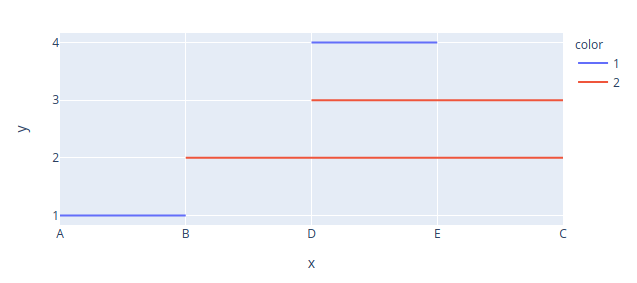
However, when using categorical axes in conjunction with colors, things do not show up in the order of the underlying data anymore.
import plotly.express as px
pdata_x = ["A","B",None,"B","C",None,"C","D", None, "D", "E", None]
pdata_y = [1,1,None,2,2,None,3,3,None,4,4,None]
pdata_color = [1,1,1,2,2,2,2,2,2,1,1,1]
px.line(x=pdata_x, y=pdata_y, color=pdata_color).show()When not(!) using colors, we would get the correct output:
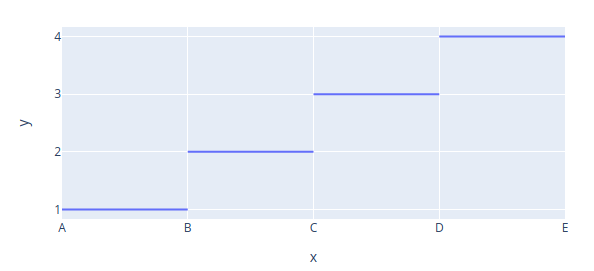
px.line(x=pdata_x, y=pdata_y ).show()For anyone who comes across this problem, a temporary fix is explicitely specifying the category order:
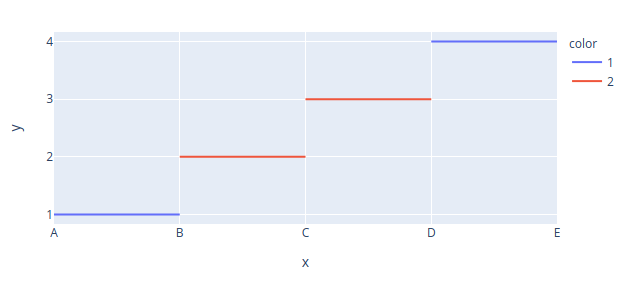
px.line(x=pdata_x, y=pdata_y, color=pdata_color, category_orders={"x":["A","B","C","D"]}).show()plotly==4.14.3
Python 3.8.0 (default, Feb 25 2021, 22:10:10)


