Episode 58: How to Turn Data Into an Experience — Featuring Miriam Quick & Stefanie Posavec
Miriam Quick
Stefanie Posavec
Welcome to episode 58 of Data Viz Today. Have you ever felt stuck when you're trying to express important data to someone? Do the bars and pies just seem to fall flat?
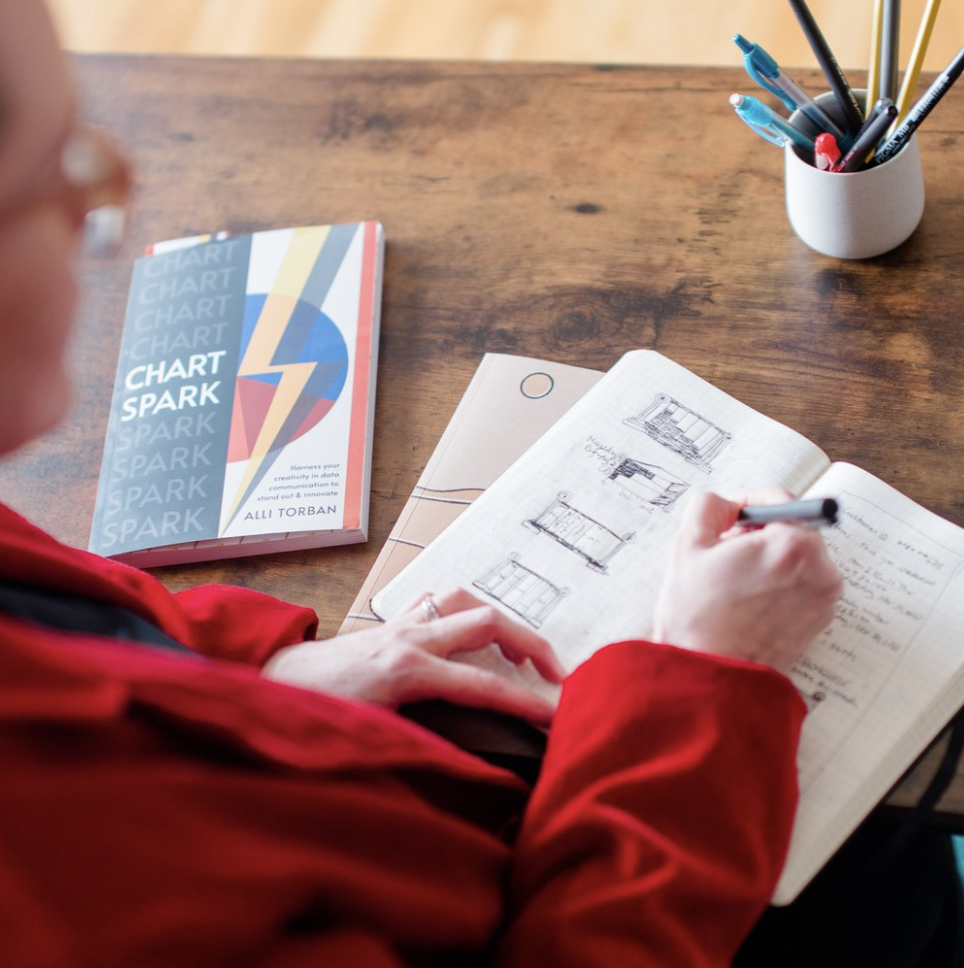
Try turning the data into an experience! In this episode, I try to bottle up Miriam Quick and Stefanie Posavec’s creative genius that they poured into their new book so that we can create data experiences in our work, too.
Listen on Apple Podcasts, Google Podcasts, Stitcher, SoundCloud & Spotify.
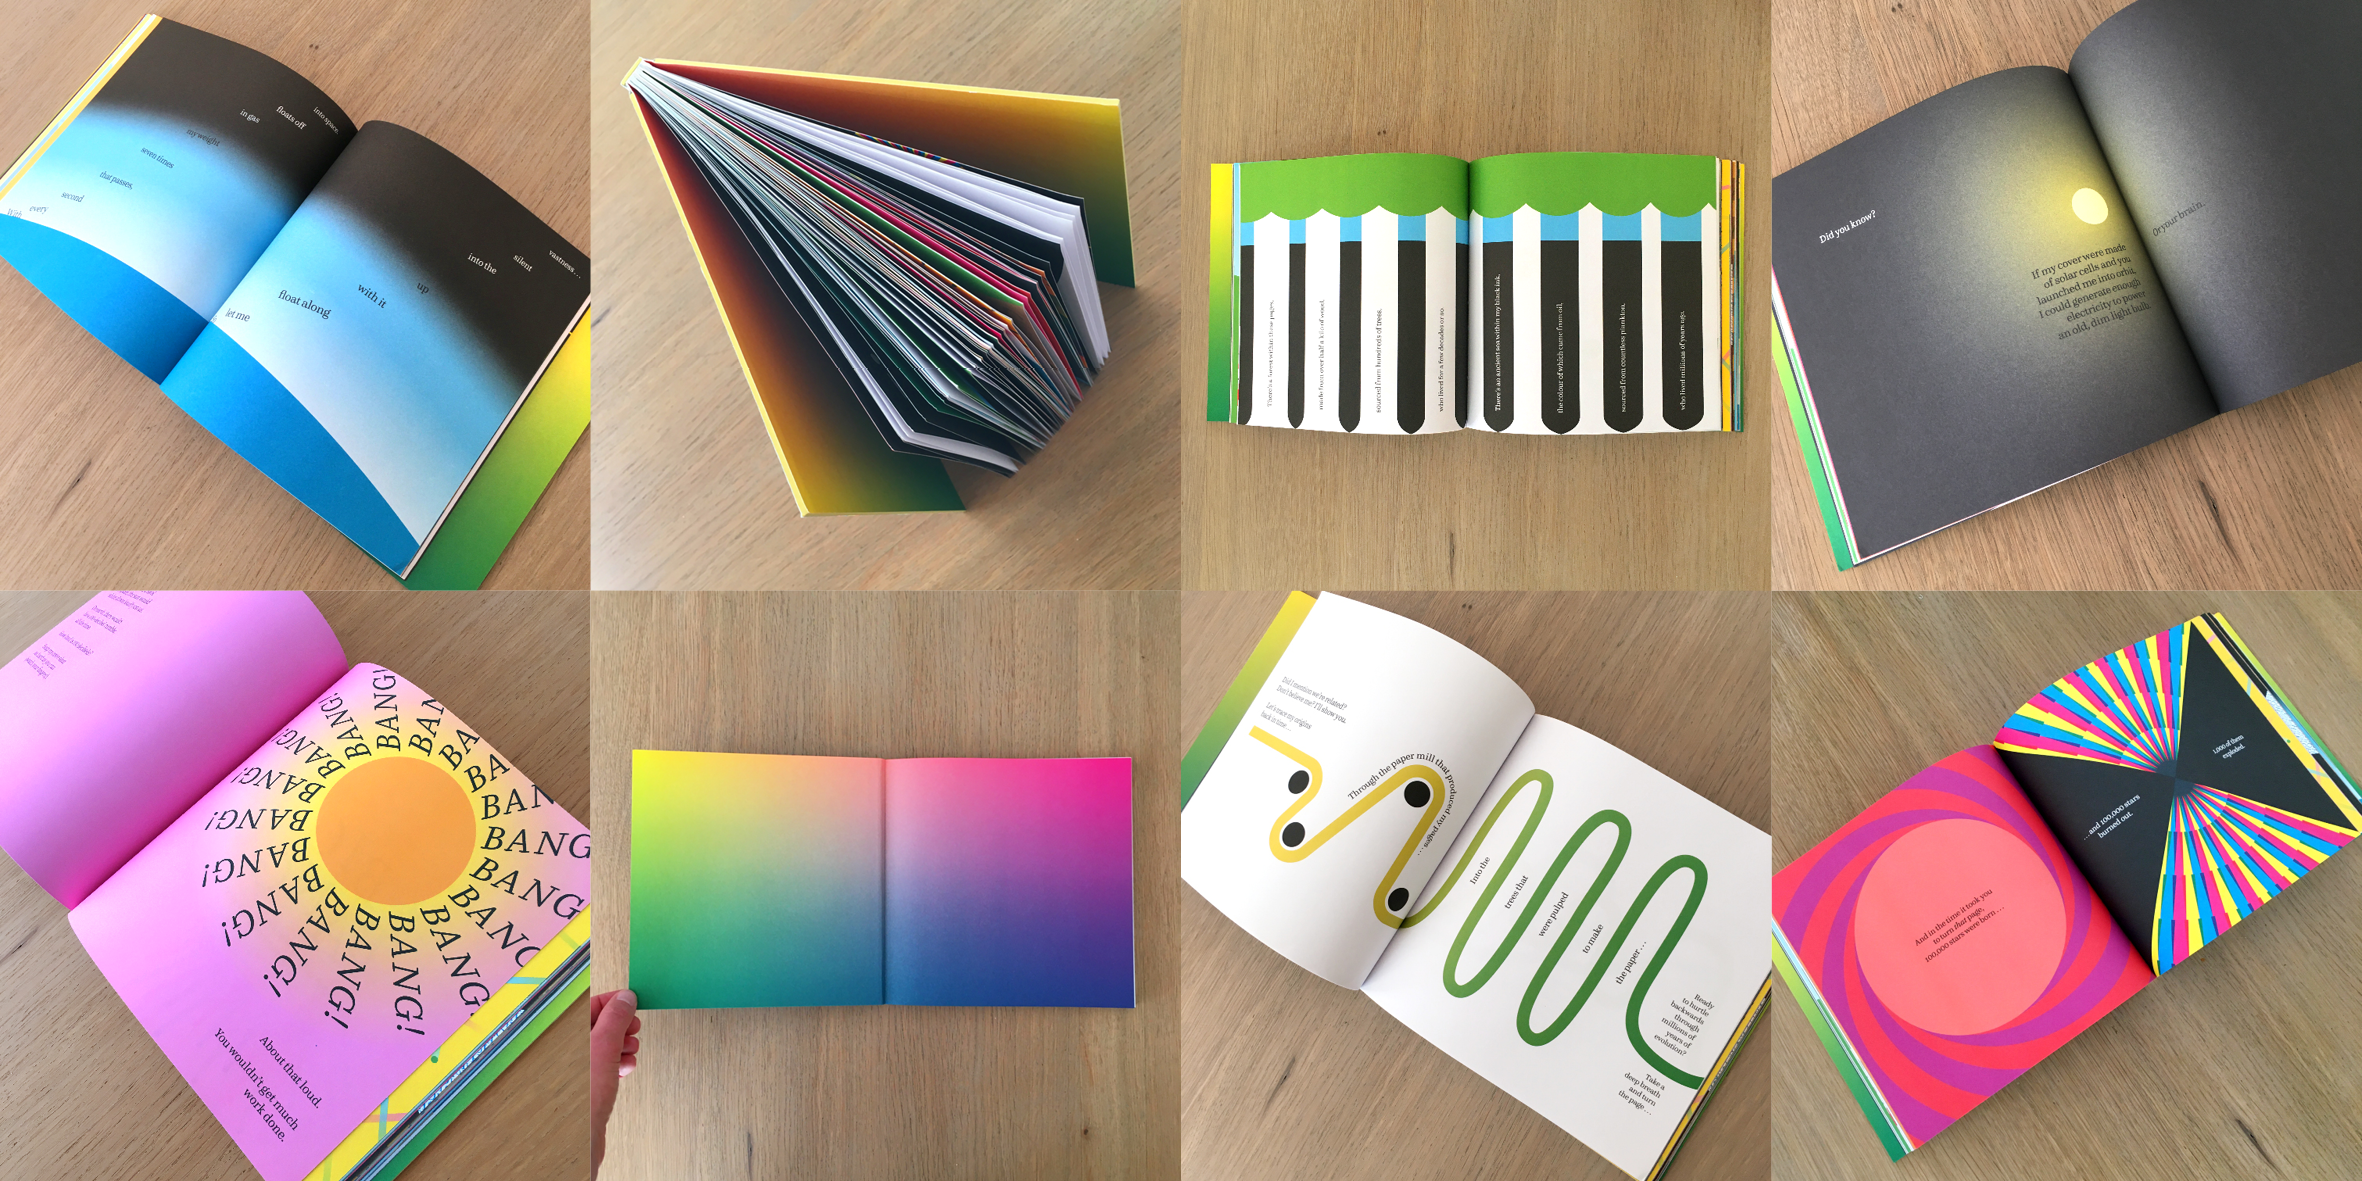
images of inside the book!
TRANSCRIPT:
Alli Torban: Have you ever felt frustrated trying to express important data to someone, maybe the bars and the pies are just falling flat or maybe turning that data into an experience could help.
Hey, you're listening to Episode 58 of Data Viz Today. I'm Alli Torban, and this show is here to help you become a more effective information designer. Thanks for joining me.
So, do you remember, this time last year, I published Episode 49: How to Communicate the Value of Visualizing Data where we talked about how data viz can help you create a connection that wasn't there before. Whether you're connecting someone to a new idea, a person, a place or to wonder, making that connection is the first step to helping someone care and to act.
And at the end of that episode, I talked about how I was most interested in finding ways to connect people with wonder; it’s something that I haven't done much of and it's hard to do.
Well, I found a way. Actually, I found a book that found the way. And that book is by Stefanie Posavec and Miriam Quick. And it's called I am a Book. I am a portal to the Universe.
Stefanie Posavec is an American designer and artist living in the UK. And Miriam Quick is a data journalist and researcher also in the UK. And they described the book as a sort of post-infographic.
And when I was reading it, page after page, I kept getting that feeling of wonder. And that's because they figured out a way to turn data into an experience using one of the oldest mediums that we have – a book.
So, of course, I wanted to chat with Stefanie and Miriam about how they came up with the concept and how we could emulate their clever way to evoke wonder. Because once you can form that connection to wonder, then you're one step closer to getting someone to care and to act.
So, here's my chat with Stefanie and Miriam. And at the end, I'll pop back in to tell you how I put my learnings into practice to turn a data into an experience for my kids. So, let's first start with how Stefanie and Miriam first met. Here's Miriam.
Miriam Quick: It was the late 2000s, me and my now husband used to put on club nights. So, we used to put on dance music nights in clubs around London, and we were really keen to put on a club night in a venue called The Foundry, which is now sadly gone, but it was in East London next to a roundabout.
And it was quite an alternative kind of venue. We approached the venue. We said, “We really want to put on this club light” and they said, “Well, you can't because we've only got 12 spots each year because of the licensing restrictions. So, what you can do is on a Sunday afternoon, you can put on an art exhibition. If you invite a lot of artists to come over and then if you play some music, well, no one's going to know and no one's going to shut you down.” So, we thought, “That's what we'll do. We'll create an art exhibition.”
So, we asked all our friends, “How many artists do you know?” and one of our friends was a friend of Stefanie and husband, Steve. And they both came along as artists to this exhibition. And Stefanie created this wonderful piece called Computerworld, which translates the length of tape required to record Computerworld. So, yeah, that was how we met.
Alli Torban: At what point did you kind of come back to that and you guys were sitting together and you felt there was something missing, some void in the universe and you thought this book would be it? What was that moment where you guys felt like you needed to create something together like this?
Stefanie Posavec: I'll say the void in the universe for me was that I was on maternity leave at the time. And so, from my perspective, I was absolutely desperate to do the project.
Miriam and I met up with my small baby on my knee. We met up in a cafe and we did what we often do; try to come up with some new ideas or new ideas for projects.
Miriam Quick: So, the idea, which we kind of fleshed out over our meeting was maybe like two hours with the aid of lots of coffee, is that we wanted to create a book where everything was on a one-to-one scale. And the data, because we always work with data together, the data would be embedded, not just printed on the page, but actually embedded into the book itself and encoded using all the dimensions of the book. So, it's weight, length, area, volume; all these different kind of physical variables that emerge from the book design process itself.
So, Stef mentioned she used to work in book design, so I knew that she would be the right person to work on this project with because she understands the process from the inside out, every detail of it. So, we started from that from that point.
Alli Torban: I know you guys talk a lot about it being almost like a measuring device, but from the way that I interact with the book and the way I've seen my daughter interact with the book, it kind of feels like to me I would describe it as you're turning like statistics or facts into experiences; like you're allowing someone to just take some random fact, like a butterfly's tongue is X centimeters long. And then you can kind of experience that for yourself. Like, how long would my tongue be if I were a butterfly? You know, just going to add in context to it. Is how you guys feel about the book, too?
Miriam Quick: Yeah, definitely. I think that's a really good way of summarizing it actually; turning data into experiences. And that's, I think, something that both of us have worked on in the past. You know, for myself, like when you're, for example, creating a summer vacation or a couple of years ago, Stef and I worked on a project called Catch Your Breath, which is all about turning our breath data along with our husbands into sound. And Stefanie created the visual art work and I created two pieces of music that were based on the data.
So, there is that strand in our way of turning data into experiences; that you can experience through time. I know that Stefanie still works where, for example, you dance the data, you dance through Facebook data as a series of dance steps.
Stefanie Posavec: Yeah, that was my art residency at Facebook where you could dance through like a month of a couple's interactions on Facebook and whether they moved across each other's timelines or tag together in a post and then you can sort of like feel their digital dance in a physical space.
And then I've also looked at kind of making open data playgrounds like hopscotches from open data sets that people could play with or like they could interpret and move through, in any way they chose, like you can with open data online. It's there for anyone to use in whatever way they choose to.
So, I think that for me and Miriam, we've always been interested in -- I guess, I think there's a lot -- We're always just trying to move beyond just visual representation, where there is this experiential aspect and where you're using variables to represent the data that potentially have never been used before.
So, yeah, I guess that interest has always been there, but it's been really great to be able to bring this interest into something that is pretty commercial, like a book for a mainstream publisher, which I am quite excited to see happen to be on it.
Alli Torban: Yeah, it's like a book. How long have books been around? But you kind of like innovated on the book. Seems like a huge feat.
So, I was hoping that we could try to bottle up a little bit of you guys’ creativity. So, do you think that you could take us through the process of one of your favorite examples in the book so we can kind of get an idea on how we can do that?
Miriam Quick: The first thing to say about that is that we actually didn't really start with the data as such. We turned the whole normal book production process on its head.
So, normally when you write a book, you start with maybe the content and then you write it and then you design it at the end. Then you might decide on the number of pages and the thickness of the paper and what kind of board you're going to have and what kind of cover finish; all that kind of stuff right at the very end.
We basically turn that on its head and we started with the book itself. We started with these dummies that the publisher made for us, which had all the final specifications of the book. So, the type of paper that we were going to use, the thickness of the board.
And then we weight these dummies and these were the basis for the facts that we could include in the book. We needed to know what the dimensions the book was going to be before we could even do the research. So, the stats kind of came second, if you like.
So, one of the first things we did when we got the book was we kind of played with these dummies and we sort of put them on the table and flipped them up and down and we said, “What can we actually do with these? What are the variables that the book has in which we can encode some data?”
And then we listed these. So, we have like weight and obviously page area, page thickness, the size of print and type on the page, typeface size, there's the thickness of the spine, there's the amount of glue or thread that is used to bind the pages, there's the thickness of the board, there's the volume; all these different variables that you can get from a book.
And we just put them in a spreadsheet and we thought, Well, we've got these variables. What ideas excite us and what ideas excites us that are the same size or could be the same size as one of these books’ dimensions.
Alli Torban: That makes so much sense. It's a very obvious and practical thing. But I obviously didn't even think about that. Because it's like if I wanted to compare something, but I needed a rope that's 20 feet long. I'd say, “Well, I don't have a rope. So, I guess we can't do that.” You'd have to start with what you actually have.
Miriam Quick: Exactly, yeah. And because we had this very tight constraint where everything in the book was on a one-to-one scale, we couldn't scale things up. We couldn't say, “Well, we're going to have a rope that's 20 feet long, but we'll sort of scale it down so it fits on the page”; like it had to actually be that size. So, yeah, we start with these variables. I think we had about 80 to 100 different variables.
And then we also had some starting point ideas. So, things that we thought were interesting. And then we thought, “Well, how can we match these together?” So, imagine like a Venn diagram. You've got variables on one side and then you've got interesting ideas, and then we sort of went for the point where they overlapped, if you like.
Stefanie Posavec: Yeah. Well, you have all the ideas and then you have to reign it in, right? Like we're like, “Wait, what can we think of? Okay, let's narrow it down, because we weren't going to use all the letters on the spread.”
So, what we decided to do is like we thought we would be very, very clever and we would only use animals who look like the letters where the name of the animal in English also started with the letter. So, like the bee looks like the wings of a bumblebee and at a lower case, F, looks like a fern and a snake and so on.
Miriam Quick: Yeah, it's about kind of trying to see the magic in everyday things and trying to reinvent them. So, we say the book is a portal to the universe. It's really something that you can just look at and then look through and then look around you and see that all the wonderful things that were actually there, which you never really saw before.
And I think also like with this spread, we were kind of alluding to like children’s picture books where you have an alphabet and you have A on one page and A is for Aardvark and bees for Bumble Bee, et cetera.
And it has this sort of deliberately kind of childlike start to the book. And then it kind of winds up as you go on. Because it's a book for both children and adults who may very deliberately going for that double readership.
Alli Torban: Yeah, I totally agree with that, because there's a lot of the things that my daughter could easily grasp by herself, but then there are some things where I kind of had to describe to her and we had to talk through it and some things that we're a little bit over her head. But it does hit that very, very well; like it's really great for both audiences.
Miriam Quick: Yeah. We wanted it to be something that the children could read and enjoy, but also adults would have something to reward and then something to return to. So, they could read to their child and then they could kind of explore a little bit more for themselves; read the end notes and get something informative and interesting out of them.
Alli Torban: Did you feel like, going through this process, you kind of built like a muscle or a habit for finding the interesting things in everyday things?
Miriam Quick: I think so, yeah. I think we did build up that muscle. And as we went on, the number of options that we had for expressing those bits of knowledge sort of decreased because we were trying to be quite systematic about how we use the variables in the book. So, we'd only use Area a certain number of times. You'd only use Volume a certain number of times.
So, we weren't always repeating ourselves, but we're instead exploring all the different ways in which the book could use its own dimensions to tell stories and communicate data. So, our options kind of narrowed as we went on.
Alli Torban: Yeah. It seems like that having the constraints at the beginning to really help guide your thinking. Because you, like you said, you had the constraints of the book and then you put on extra constraints of only using certain things at certain times and then only expressing things a certain way one time.
Miriam Quick: Yeah, definitely. Yeah. We had a lot of constraints, like with this alphabet spread, we have obviously, size constraints in terms of the lower limit, really, was the smallest readable letter, which was, I'm not sure, I think was 8 point font we decided, wasn't that, Stef?
Anyway, we this is the smallest readable letter that you can fit on the page. And the smallest kind of practical limit of what you can fit on a page or what you can actually see is about 0.1mm. And there is actually a dot in the book which represents the actual size of a human egg, which is about 0.1mm.
And then at the other extent, at the larger end of the scale, you've got 20 centimeters, which is the height and the width of the page, because it's a square page. So, yeah, those were our constraints really.
So, we really tried to use our constraints as a kind of trigger for coming up with new ideas and being more creative.
Alli Torban: Miriam, what was your favorite one in the book that you did?
Miriam Quick: Oh, I really enjoyed researching the spread on neutrinos. So, there were these little subatomic particles called relic neutrinos, which were formed in the first few milliseconds, I think, after the Big Bang. And they are really, really hard to detect. And it's believed that there are about 330 per cubic centimeter; kind of evenly distributed throughout the universe. And I thought, “Well, this is mysterious. You know, these are these wonderful things which are there all around us and it in us and moving through us all the time, but which we are not aware of and we don't see.”
And I applied that 330 per cubic centimeter to the volume of the book. And I think it's over a 177 thousand or 90 thousand relic neutrinos that are floating through the book any one time.
So, that was really like jaw dropping to research. Because I'm not a physicist; I wasn't aware of these things before and I thought, “What a wonderful thing. This idea that there's all this stuff around us all the time that we don't see it.”
Alli Torban: Stefanie, how about you? What was your favorite one?
Stefanie Posavec: It's this one where Miriam, she recorded how long it takes to read a certain amount of text on average. And then so, while you read the text, she's researched, how many things are happening in the world in the amount of time that it takes you to read that text.
And so, it's a very, very simple spread. It's text and it's a shape. And I struggled with this for about -- I mean, I probably had like 30 to 35 different iterations of how to present this and then present -- Like there's a clever bit at the end. Something happens at the end of this like, long bit of text. Ans so, how do I illustrate it? How do I present it?
Alli Torban: Yeah, I really like that one too. My favorite is just, you know, you put your finger up to the edge of the book and then it shows you how long your fingernails will would have grown over two years.
Miriam Quick: Yeah. Yeah. And also, in that spread, the one that I found really astounding is that bamboo grows by up to 90 centimeters a day.
Alli Torban: Oh yeah. That was mind blowing.
Miriam Quick: Yeah.
Alli Torban: I didn’t had no it grew that long. I was like, “You turn around and it's grown!”
It was great chatting with you guys today. Thanks so much.
Miriam Quick: Thanks. Thank you very much.
Stefanie Posavec: Thank you.
Alli Torban: Chatting with Miriam and Stefanie reminded me of one of my favorite quotes;
“There are no uninteresting things, only uninterested people.”
They really proved that you can spark interest in the most seemingly mundane things if you look at it through the lens of curiosity. Okay. So, I wanted to immediately try this out, what we were talking about, with Stefanie and Miriam.
So, first, I looked around with what I had. I pulled out a few things in my kitchen. I had like a spoon and a bottle of sprinkles and an orange. And I just wrote down a few aspects of them. And I settled on using the height of a single sprinkle.
And I wanted to take this tiny thing that we just use occasionally to put over ice cream, to kind of transport my kids someplace else and make them feel wonder about the world. Very tall order.
So, I thought about how I could compare the height of the sprinkle to the height of my older daughter. And she's about four feet tall. And thinking about things near us, I found that using proportions at the height of the sprinkle to the height of my daughter was the same proportion as the height of my daughter to the height of the Washington Monument here in D.C., which they have seen before in pictures or just driving by, but they actually haven't stood next to and it is a very different experience.
So, I went to their room with this tiny pink sprinkle and I told my daughter to stand up and I held the sprinkle at her feet. And I told her that if this little sprinkle were her, then she would be the Washington Monument; they’re the same scale.
And I thought that was hilarious, thinking about themselves as little sprinkles. And they had a good laugh at pretending that she was a statue.
But then my oldest asked how people even build statues that tall, and I told her I wasn't sure, but I could look it up later and it was probably with pulleys or scaffolding or something.
And she was like, “I remember seeing something like that in this World Factbook that we have about how Egyptians built pyramids; they used ramps and ropes. And we talked about how hard it would be to pull rocks all day with a rope.
And it was just a really fun experience. And to think that a little pink sprinkle could be the catalyst to talk about architecture and history and empathy, it was a really amazing thing.
So, my final takeaway is in order to turn data into an experience, you don't need a lot. You first need to think about the physical things that you do have at your disposal. You can't think up an experience with 100 pounds of pumpkins, if you don't have that.
And then just pick out a couple of potential -- Once you pick your objects, think about what you could measure or the aspects or the properties of that thing; like its height or its weight or how fast it grows or how long it lives.
And just try not to rule anything out; try to find the interesting things in everyday objects and brainstorm things what you could compare it to. Maybe you already have an idea about what experience you want to lead to, or maybe you don't. I had no idea where it would lead to give my kids a sense of wonder at the height of Washington Monument. And then you're just a few simple math equations away from conveying your experience to someone else so that they can feel the sense of wonder.
If you want to email me what you create, I would love to see what experience you created, because I'm always looking for new ideas on how to create wonder. You can contact me. I'm at alli@dataviztoday.com.
Thanks for joining me today. Thanks to Stefanie and Miriam for sharing your inspiring project with us and definitely get their book. I really love it. You can go to iamabook.online and see more information there about it. And all the show notes are at dataviztoday.com/shownotes/58.
Thanks to Heidi Horchler for my amazing cover art. I'm Alli Torban and remember, you are what you constantly think about. So, join me in thinking a lot about awesome data viz and subscribe to the show so you never miss an episode. Bye now.